
Why can one airplane take off and land on short runways while another requires significantly longer takeoff and landing distances? Why does one airplane have better performance (rate of climb, airspeed) than another? Is the airplane you’re about to fly underpowered or overpowered? The answers to these and similar questions lie in understanding fundamental aerodynamic concepts like wing loading and power loading.
288
When I mention them while conducting flight reviews and instrument proficiency checks, many pilots look at me as if I’m speaking the Vulcan language from Star Trek. One pilot with about 2000 hours of flight time told me wing and power loading were esoteric concepts, not relevant for everyday flying, and the purview of aircraft engineers only. A naïve, marginal flight student stated wing loading was having many people atop the wings of an airplane. (That former student quit flying and decided to run for public office—a future senator no doubt.)
All of which highlights the problem: Many pilots seem to have a cursory or no understanding of some important aerodynamic concepts. Let’s try to fix that, by discussing how wing and power loading are determined, their implications for aircraft design implications on wing and power loading, and factors causing wing and power loading to be moving numbers.
What’s Your Loading?
Wing loading, or the ratio of an airplane’s weight to its surface area, is the average load each unit of the wing must carry. It’s determined by dividing an airplane’s current weight by its wing surface area, as expressed in Formula 1 in the sidebar on the opposite page.
Power loading, the ratio of airplane’s weight to engine power output, is determined by dividing a propeller-driven airplane’s current weight by the engine’s generated horsepower (hp). For a jet-powered airplane, power loading may be determined as pounds of weight per pounds of jet thrust. This is represented as Formula 2 on the opposite page. An example of how these formulas are applied is included.
So, exactly what do these numbers mean? In general, airplanes with larger wing area and lower weight—or with a relatively low wing loading—fly more slowly than an airplane with a higher wing loading while airplanes with a smaller wing area and higher weight, or high wing loading, fly faster. As an example, compare a glider—low wing loading—to a military jet fighter and its much higher wing loading.
288
Power loading is used to determine if an airplane is underpowered, appropriately powered, or overly powered. Airplanes with relatively low horsepower engines and higher weight—i.e., with high power loading—fly relatively slowly and may be considered as underpowered. Airplanes with more powerful engines and less weight—or with a very low power loading—are capable of flying significantly faster and may be considered appropriately to overly powered. Obviously, appropriately and over-powered airplanes are capable of greater airspeed and climb performance than ones with low power loading.
Wings And powerplantS
Aircraft are designed to address specific needs, which, in turn, affect wing and power loading. For example, if an airplane is intended for short-field takeoff and landing (STOL) operations, where fast cruise speeds and high rates of climb are not priorities, a large wing surface area relative to the airplane’s weight is used to minimize wing loading and maximize lift. The result is an airplane with short takeoff distance and low lift-off speed, as well as short landing distance and low landing reference speed (VREF).
An example is the Fieseler Fi 156C “Storch” pictured below, a small, WWII-era German liaison airplane. It has a maximum takeoff weight of 2740 pounds and a large wing surface area of 280 square feet, resulting in a low wing loading of 9.78 pounds/square foot. In addition, fixed slots along the entirety of its wings’ leading edges and large slotted flaps on the trailing edges enhance lift for STOL operations. It’s powered by a 240-hp engine, resulting in a moderate power loading of 11.42 pounds/hp. The Storch has excellent STOL performance; tests revealed takeoff and landing distances to be approximately 150 feet and 54 feet, respectively. Although low wing loading is advantageous for STOL operations, there is a penalty: The greater the wing surface area, the greater is the drag, which compromises cruise speed.
Airplanes designed with high wing loading—compared to those with relatively less wing loading—require longer takeoff and landing distances. For example, compare a Cirrus SR22 with wing loading of 23.5 pounds/square foot, to a Citabria 7GCBC with a wing loading of 10.6 pounds/square foot. That’s 55 percent less than an SR22. Further, the SR22 has a sea level, standard day takeoff ground roll at maximum weight (3400 pounds) of 1058 feet; its landing ground roll is 1161 ft. The 7GCBC has a sea level/standard day takeoff ground roll at maximum weight (1800 pounds) of 231 feet. Its estimated landing distance under the same conditions is a mere 200 feet.
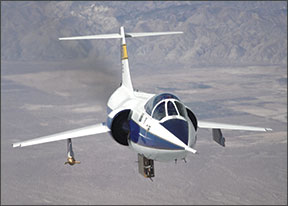
When fast cruise airspeeds and high climb rates are intended—and STOL is not a priority—engineers design airplanes with high wing loading and low power loading. The lower the power loading of an airplane, the greater will be its performance (airspeed and rate of climb) and vice versa. For example, the F-104 “Starfighter,” pictured below, is characterized by very high wing loading and low power loading. It weighs 24,840 pounds and has a small wing surface area of 196 square feet. Consequently, wing loading is high at 126.7 pounds/square foot. Its engine generates 14,800 pounds of thrust (afterburner on), resulting in very low power loading of 1.67 pounds of thrust, or a thrust-to-weight ratio 0.59. As one result of its low power loading, the F-104 is capable of Mach 2 speeds and has a phenomenal rate of climb: 60,350 feet per minute.
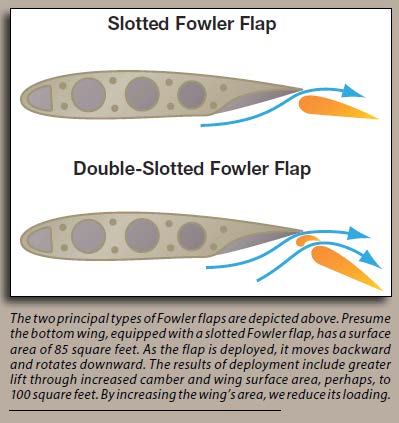
The type of flaps employed is another design factor affecting wing loading. For example, Fowler flaps increase wing surface area and—depending on the airplane—when fully deployed, wing surface area may be significantly greater. If you’ve been paying attention so far, you know one result of increasing a wing’s area is a reduction in its loading. The drawing at upper left might help.
288
A light sport aircraft (LSA), designed to meet a specific maximum weight of 1320 pounds, typically has low wing loading, approximately 10 pounds/square foot. Compared to aircraft with much higher wing loading, these aircraft are airborne at lower airspeeds and in shorter runway takeoff distances, tend to float on landing if speed is too great and are more affected by crosswinds at lower airspeeds. Additionally, they have reduced stability and a greater tendency to be bounced around by windy and turbulent conditions, wind gusts and thermals. They also may be harder to control and usually will have lower stalling speeds (VS) when compared to a similar airplane. An LSA’s low wing loading can require greater effort to compensate for crosswinds and turbulence during landings.
Just the opposite, airplanes with high wing loading have a smooth ride in turbulent conditions. For example, a Boeing 747 model has a wing loading of 133 pounds/square foot. The U. S. Air Force B-1B bomber has an astonishingly high wing loading of 239 pounds/square foot. Heavily wing-loaded airplanes expose less wing area to vertically sheared and horizontally sheared wind gusts, making the airplane less susceptible to vertical (positive and negative Gs) and lateral acceleration (yaw). The charts on the opposite page provide examples of airplanes with different wing and power loadings.
Changing Numbers: Wing and power loading
Like stall speed, wing and power loading values are not constant and change with flight conditions. For example, current weight, a common factor in the aforementioned equations, directly affects wing loading and power loading. The word “current” connotes that aircraft weight is a variable. For example, a Cessna 172S has a Utility-category maximum takeoff weight of 2200 pounds, Formula 4, below. At the same airplane’s Normal-category max takeoff weight of 2550 pounds, wing loading and power loading decrease proportionately by approximately 14 percent.
A situation having the opposite effect on wing loading and power loading is a steeply banked, constant-altitude turn. For our Cessna 172S at 2550 pounds in a 60-degree bank, constant-altitude turn, the load factor is 2G, which has the effect of doubling the airplane’s weight to 5100 pounds. Under this condition, wing loading and power loading (assume constant horsepower) increase by nearly 100 percent compared to its 1G ratios. Formula 3, on page 5, calculates the 172S’s gross-weight wing and power loadings while Formula 5, below, does the same thing at 2G.
It should come as no surprise wing loading also has a direct effect on stall speed, which also is a moving number affected by a variety of factors. For example, VS increases in proportion to the square root of a wing’s loading (Formula 6). Quadrupling wing loading doubles VS, as well as takeoff and landing speeds.
In the power loading equation, Formula 2 on page 5, the word “generated” preceding horsepower connotes engine horsepower is not constant. Instead, it varies with throttle settings and with altitude. In fact, engine power output decreases by approximately three percent per 1000-foot increase in density altitude for an aircraft with a normally aspirated engine. For example, at 5000 feet density altitude, our Cessna 172S engine— capable of generating 180 hp at sea level, generates a maximum of only 153 hp, a 15-percent reduction. Assume a load factor of 2G while in that 60-degree bank, constant altitude turn. What happens to power loading? It increases, by 134.5 percent, and performance is compromised.
The greater the power loading, the worse the acceleration and climb capability, and vice versa. Consider our trusty Cessna 172S loaded to 2550 pounds and taking off from an airport with a density altitude of 7000 feet. Engine output decreases by 21 percent, from 180 to 149 hp, versus sea-level performance. Consequently, power loading is adversely affected, and increases to 17.1 pounds/hp, a 20.4-percent increase. High power loading explains, in part, why acceleration and climb performance are significantly compromised during takeoff and climb out under high-density altitude conditions.
Twin-engine airplanes (propeller and jet) may fly under two different power loading conditions, with both engines operative and one engine inoperative (OEI). With both fans turning, many twins have lower power loading and are relatively overly powered when compared to many single-engine airplanes, allowing twins to have greater rates of climb and faster airspeeds during departure. For example, power loading for many twins is approximately 10 pounds/hp with both engines operating, while power loading for a Cessna 152 is 15.2 pounds/hp and for a PA-28-161 (Warrior II) it is 14.5 pounds/hp. There are exceptions. For example, the single-engine Extra 300L aerobatic airplane has low power loading (6.9 pounds/hp), giving it high-performance capabilities for aerobatic competition.
During OEI conditions, however, power loading increases significantly for twin-engine airplanes. For example, it increases by approximately 90 to 100 percent, and rate of climb and airspeed are compromised significantly. With sudden and significantly large increases in power loading due to failure of an engine after takeoff, twin-engine airplanes abruptly change from being appropriately powered to underpowered. This helps explain why twin-engine airplanes have such marginal performance with failure of an engine immediately following takeoff. A notable exception is the relatively overly powered Learjet 35A. With both engines operating, it has a very low power loading of 2.6 pounds/thrust; during OEI conditions, power loading increases to only 5.2 pounds/thrust, allowing appropriate performance.
Everyday Application
Being a safe, competent pilot requires more than knowing how to fly an airplane under various flight conditions. It also includes a practical understanding and application of relevant aerodynamic concepts like wing and power loading. Airplane performance and handling characteristics are significantly affected by the magnitudes and interrelationships of these two variables, to include but not be limited to takeoff and landing distances, climb performance, cruise airspeeds, airplane stability and VS.
For example, when maximum takeoff performance is desired—as during a short-field takeoff—a pilot may decrease wing loading and power loading by reducing useful load. Reducing airplane weight by 10 percent decreases takeoff distance by approximately 20 percent. Stated another way, to improve performance, change the wing and power loading. Knowledge of these concepts help pilots to better understand their airplane’s capabilities.


