
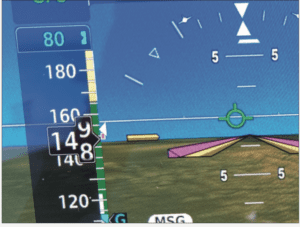
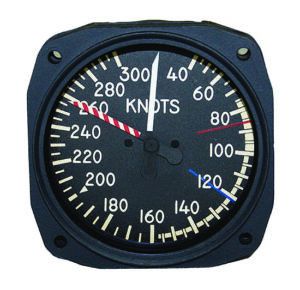
Look at an airspeed indicator or vertical speed tape, as below, in a piston-powered airplane and you’ll see a yellow range of indicated speeds. This is called the “caution range.” Since typical piston airplanes can’t cruise in this speed range under most circumstances, we often don’t spend a lot of time learning how very different the airframe overstress protection scheme is when operating in the yellow arc instead of the green one. It’s not like the FAA decided to spice up airspeed indicators with a splash of color: There is a very real reason for the caution range of the airspeed indicator.
THE YELLOW TRAPEZOID
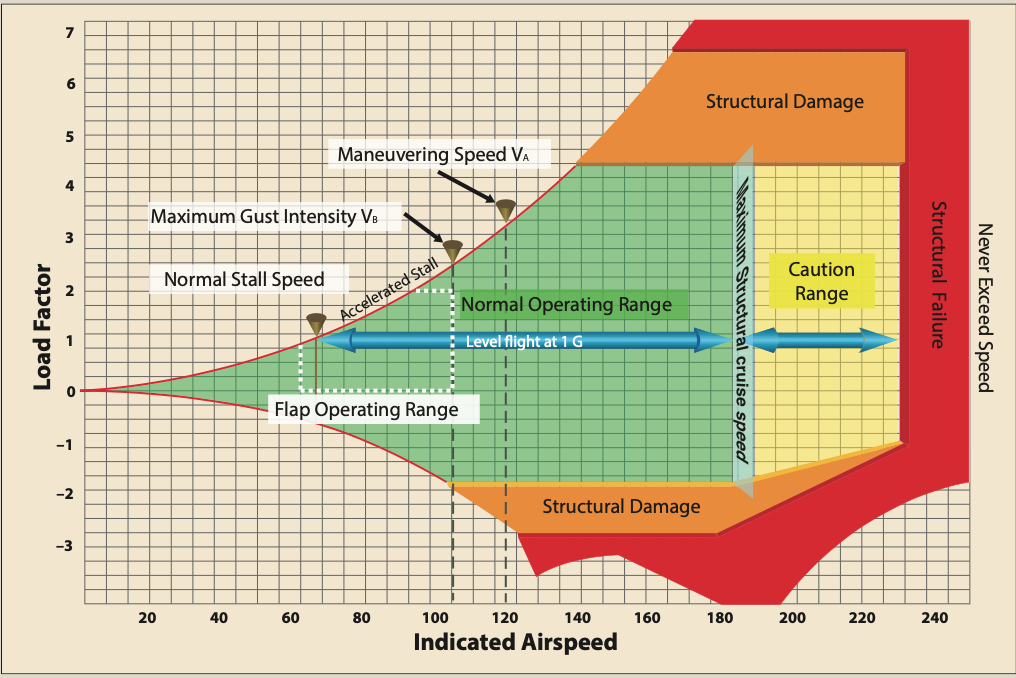
A truly fascinating diagram (if you’re into such things) is usually only briefly introduced in pilot ground schools and pops up occasionally in articles such as this. The Vg diagram, “V” for velocity and “g” for g-load or load factor, shows the relationship between an aircraft’s airspeed and the resulting forces from operating at those speeds. An example is reproduced at the bottom of the opposite page.
All speeds are indicated, the result of actual atmospheric “push” against the aircraft. Although unique stresses at very high speed and/or high altitude may cause an aircraft’s limiting speeds may be lower, the shape of the diagram would be the same…but the entire graph would slide to the left along the airspeed scale.
The Vg diagram from the FAA’s Pilot’s Handbook of Aeronautical Knowledge (FAA-H-8083-25B, colloquially called the “PHAK”) is generic in that it uses airspeeds, strangely in miles per hour rather than the usual knots, for a hypothetical aircraft (opposite page). As noted in the PHAK, “each aircraft has its own Vg diagram that is valid at a certain weight and altitude.” The PHAK takes a stab at explaining this very complex diagram in a few words on pages 5-37 and -38. Stick to the definitions of the speeds that define the boundaries of the normal operating range and the caution range, and you’ll learn how this diagram applies to the yellow arc.
If you’re confused by the differences in VNO, VA and a published turbulent air penetration speed, you’re not alone. Each of these limit speeds provides a different level of airframe (and therefore aircraft occupant) protection. The FAA defines VNO and VA thusly:
- Maximum structural cruising speed, VNO, is the highest speed you can safely fly in smooth air. It’s depicted as the upper limit of the green arc on an airspeed indicator. If you fly above VNO—in the yellow arc or “caution range”—and you encounter air that is not smooth, you could cause damage to the aircraft.
- Design maneuvering speed, VA, is the maximum speed at which the airplane will stall before the structure is damaged by excessive loads. If you encounter a gust that causes a sudden, significant increase in load factor while flying above VA, the aircraft could experience structural failure. And VA changes with the aircraft weight; it decreases as weight decreases and increases as weight increases.
The published VA is the speed that applies at the airplane’s maximum gross weight. Flying at or below the design maneuvering speed does not allow a pilot to make multiple large control inputs in one airplane axis, or single control inputs in more than one airplane axis at a time, without endangering the airplane’s structure.
Another value, VB, Design Speed for Maximum Gust Intensity, is not so clearly defined. It is often referred to as the turbulent air penetration speed. Certification requires aircraft with a maximum gross weight greater than 12,500 pounds to define this speed within a range from no higher than the speed at which a 66 fps (4000 fpm) change in wind speed and/or direction will cause the airplane to exceed VA, to no lower than the loss of wind at that same intensity will not cause the airplane to indicate lower than VS1, stalling speed in the clean configuration. Light airplanes do not require a published VB, and most manufacturers recommend flying at or below VA when in turbulent air. I’d clarify this to say that in moderate or greater turbulence, the pilot should slow to a speed at which the maximum speed reached in gusts is still below VA for the airplane’s current weight.
Consider also: At VA, the aircraft may reach its maximum g limit before stalling and unloading the wing. It won’t cause structural damage, but it’d be a wild ride—going from 3.8 or 4.4 g to zero g in an instant—for those on board. Slower is better, as long as the airspeed remains above VS1 during turbulence excursions.
One more thing: all these speeds, vital to airframe protection in turbulence or while maneuvering, occur within the green arc, normal operating range, as depicted in the Vg diagram below.
IT’S GOOD TO BE GREEN
But first, the green arc. The “low end” of green arc is defined by VS1, the stalling speed in the clean (flaps and gear up) configuration. On the Vg diagram this is the left vertical edge of the green area. On the high end, it’s limited at VNO, the maximum speed for normal operation. VNO is more appropriately defined as the maximum structural cruise speed, and is represented by the right vertical edge of the green area. The red curving lines that describe the top and bottom of the left part of the green area represent the speeds at which the wing will enter an accelerated stall under positive g load (the upper line) or negative g load (the lower line). Read the scale at left from any point on these lines and you’ll see the load factor at which this stall occurs. On this diagram, when the line reaches 4.4 positive g or 1.76 negative g, the airspeed is such that any increase in load (positive or negative) would result in aircraft structural damage. On the positive side, this point is defined as VA, the maneuvering speed. There is no corresponding definition of the speed on the negative g side.
From that point to the right of the green area, the top of the normal operating range is defined by the maximum positive g load, the bottom by the maximum negative g load. It’s possible to exceed maximum load factor without stalling the wing at these speeds, i.e., the airplane has the control authority to overstress the airframe. Note that these limits, +4.4 and -1.76, are for an aircraft certified in the utility category. If the aircraft is in the normal category, these limits would be at the +3.0 and -1.52 levels. In aerobatic aircraft, they are at +9.0 and -3.0 g.
All this sets the stage for what happens beyond the maximum structural cruising speed. This caution range extends from VNO to VNE, the never-exceed or “red line” airspeed. It has the same positive g limit but gradually slopes from the maximum negative g limit to one negative g at VNE. Clearly something is different in this yellow trapezoid. What happens here?
Aircraft certification rules require establishing limit speeds that provide protection against damage in the green arc based on encountering a 30 fps wind shear. That’s a rapid, 1800 fpm change in wind speed or direction. Stay below maximum structural cruise speed and hit a shear of this magnitude and no permanent damage should occur. This is different from maneuvering speed and turbulent air penetration speed; see the sidebar on the previous page.
Certification rules for piston-powered aircraft give the manufacturer a break at VNO. Above VNO the wing has only to withstand a 15 fps gust, or 900 fpm, up to red line, VNE. In other words, structural protection is cut in half above VNO, while the aircraft has the control authority to exceed its maximum load factor. That’s why the yellow arc is a “caution” range, and why you want to remain in the green arc except in very smooth air.
Turbine airplanes do not have an airspeed indicator yellow arc caution range. As one result, their certification does not include a region of reduced airframe protection similar to the caution range in piston airplanes. Further, many turbine aircraft are able to operate at speeds and altitudes where the never-exceed speed drops.
That’s why turbine airplanes don’t have a red line VNE on the airspeed indicator—they have a VMO indicator, for maximum operating speed, that automatically moves up and down the airspeed scale to indicate the maximum speed under current conditions. This indicator is marked with alternating red-and-white stripes and so is colloquially called the “barber pole.”
The barber pole indicates an airspeed that, if this value was fixed under all conditions, would be the VNO or “top of the green arc” in a piston airplane. A peculiarity of turbine engine modifications of piston airframes is that the yellow arc goes away and the new VMO limit is that airframe’s original VNO. Hang a turboprop on a Beech A36 Bonanza, for example, and the maximum speed drops from the original 205 KIAS to 167 KIAS. At lower altitudes, the turbine Bonanza pilot must significantly reduce power to remain below VMO and within the original green arc limitation.
THE HIGH END
At the high (airspeed) end of the yellow arc we have VNE, the never-exceed speed. At or above this speed, even minor control deflections may impart enough force to overload the airplane and cause structural damage. How is VNE determined?
In simplified form, during aircraft certification, a test pilot must dive the airplane to a very high speed, and sustain it very briefly with no flutter, no control reversal and no failure of the primary structure. The airplane must be flown to 150 percent of its VNO, the top of the airspeed indicator’s green arc. If the manufacturer defines a VC, or maximum cruise speed, and that speed is higher than VNO, then the dive must be flown to 150 percent of the higher speed. Once the dive tests are complete, VNE, the never-exceed or redline speed, must be set by the manufacturer at no more than 90 percent of the maximum demonstrated dive speed.
For example, during certification the Beech Bonanza was dive-tested to 248 knots indicated airspeed. Ninety percent of that speed is 223 KIAS. But Beech was a little more conservative, establishing red line speed for Bonanzas at 80 percent of the demonstrated dive speed, or 203 knots (plus or minus a couple of knots for indicator calibration over time). This gives an additional safety factor to maintain structural strength. In early models, the manufacturer set VNO artificially lower, 140 KIAS in the earliest variants, but in later models it increased VC/VNO to the 166-knot level allowed by the 248 KIAS test. This provides a high VC indicated airspeed for high-speed cruise in smooth air.
Look at VNO for the airplane you’re flying, or VC if its handbook’s limitations section includes a maximum cruise speed. Be assured that at some point a brave test pilot dove a prototype of that airplane to 150 percent of that figure without damage, control reversal or flutter…in very smooth air.
Discussion of maximum load factors often turns to the certification margin of safety. It’s true that there is a margin between design or limit load, defined terms in the FARs. In other words, the published maximum, and the ultimate load. Ultimate load is 150 percent of design load—for the utility-category airplane depicted in the Vg diagram on page 5, design load is +4.4 g and ultimate load is +6.6 g. But there is a significant difference between the two—you don’t have the same protections all the way to the ultimate limit.
Certification requires the airplane to withstand up to design load without damage to the aircraft’s primary structure. The airplane will not suffer catastrophic failure of primary structure unless it exceeds the ultimate load. However, in the margin between design and ultimate limits, the aircraft primary structure will likely be damaged or permanently deformed, just not to the extent the airplane breaks apart in flight. Exceeding the design load limit will still severely damage and possibly total the airplane.
FLYING IN THE YELLOW
So is it safe to fly in the yellow arc? In general yes—as long as you are certain you will not encounter stronger than “light” turbulence; and/or you will not need to move a single axis of flight control (elevator, aileron, rudder) to its maximum deflection to counter excursions from a gust, to recover from wake turbulence or because you choose to make an abrupt maneuver; and/or you will not need to apply some undefined amount of control input in more than one axis at the same time. In other words, if you will continue to fly with essentially no change in control position, and the air is predictably smooth, you may safely fly in the yellow arc.
You’ll need to have a high level of knowledge about the factors that may cause turbulence, and a corresponding situational awareness of how those conditions may have changed since your last weather update. Unless you’re not absolutely certain you can maintain essentially neutral flight controls and avoid turbulence, it is not safe to fly in the yellow arc.
Some airplanes may accelerate into the caution range in cruise flight, especially if they have been modified with a more powerful engine than was installed on the airframe during certification. The more likely scenario is accelerating into the yellow arc during descent, by lowering pitch but not reducing power.
Some pilots like the “free speed” of a power-on descent, but this is when you’re most likely to encounter unexpected turbulence. It’s not a legal limitation, but if pressed, most manufacturers would suggest descending at the top of the green arc or even at VA when adjusted for the airplane’s current weight.
Lastly, there’s empirical evidence, but no definitive data, suggesting the fatigue resulting from flight at higher speeds may not be enough to noticeably damage the airplane. But over time, that fatigue may be cumulative and eventually lead to cracking, flutter or even outright failure. Many pilots of decades-old airplanes advise staying out of the yellow arc not because of what a single encounter might do, but what impact there might be from dozens or hundreds of repetitive exposures over time.
The yellow arc is a range of indicated airspeeds derived during aircraft certification. It describes a regime in which the airplane will withstand very minor turbulence and/or small control deflections, but where there is no built-in airframe protection to prevent dangerous overload such as exists at lower speeds. It is indeed a speed range to fly in only with extreme caution.
Tom Turner is a CFII-MEI who frequently writes and lectures on aviation safety.


Good explanation. As a rule for the last 28 years I have owned my F35 I never fly out of the green. The plane is plenty fast as it is, I don’t need more and though it is in great shape has been eligible for Medicaid for three years now.
Good article, as usual, from Tom Turner addressing an important and often glossed over topic. One minor point that I find consistently frustrating in discussions of the V-G diagram, and its kindred, in FAA publications is that the numbers on the vertical and horizontal scales do not consistently align with corresponding sets of horizontal and vertical lines respectively of the background grid. This is not a fault with Tom’s article, he incorporates the generic V-G diagram from the PHAK – and from an author’s perspective there are plenty of good reasons for doing so. While that generic diagram is sufficient to illustrate the basic concepts it doesn’t allow for precise interpretation of specific airspeeds and g-loads. Take Va in the diagram, follow the dashed line down to the airspeed scale. Is Va for this diagram 120 exactly, a slightly lower value or a slightly higher value? At Va, what is the g-load to within a 10th of a G? I know I’m being picky and a bit of an engineer, but a true V-G diagram should be able to answer questions like this. It is one thing to have an accurately constructed V-G diagram of a ‘generic’ airplane that can be used to provide quantitatively accurate answers to the g-loads for a given critical airspeed (Vso, Vs1, Va, etc.). It is quite another to have a generic diagram which provides confusing or ambiguous answers to those same questions. If a student pilot, rusty pilot, or current pilot can’t use the PHAK’s V-G diagram to give clear answers to these kinds of questions, what motivation will he or she have to use an accurate version of that same diagram for his or her airplane?