
It’s not a secret that the vast majority—almost 70 percent in 2010, according to the AOPA Air Safety Institute—of non-commercial general aviation accidents are caused by or result from loose nuts behind the wheel: pilots. According to the AOPA ASI 2011 Nall Report, which looked at all GA accidents during 2010, “Most pilot-related accidents reflect specific failures of flight planning or decision-making or the characteristic hazards of high-risk phases of flight.”
Those failures—to plan adequately, to make good decisions or to engage in high-risk activity—are at the root of GA’s relatively flat total and fatal accident rates over the last decade. It’s reasonable, then, to ask what, if any, differences are there between pilots who become involved in accidents and those who don’t? Thankfully, the NTSB did this for us, even if it was several years ago. What can we learn from it?
Background
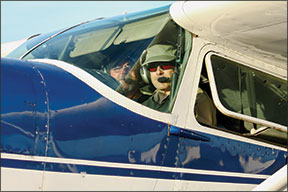
The NTSB study, “Risk Factors Associated with Weather-Related General Aviation Accidents,” was adopted by the full Board on September 7, 2005. It looked at 72 GA accidents occurring in the U.S. between August 2004 and April 2004. As such, we’re coming up on 10 years since the accidents comprising the study occurred. The study’s goal was “to identify factors that are predictive of accident risk for GA pilots flying in weather-related conditions characterized by poor visibility, like IMC or marginal VMC.”
The interesting thing about the study, however, is “study managers…contacted pilots of flights that were operating in the vicinity at the time of those accidents for information about their flight activity. A total of 135 non-accident flights were included in the study.” In other words, the NTSB compared attributes of accident and non-accident pilots dealing with the same weather conditions at the same time.
In our view, proliferation of two technological advances should favorably impact GA’s accident record since 2005: glass panels and in-cockpit weather data. But it’s not at all clear they’ve helped. In fact, the NTSB in 2010 published a study on glass panels effect on safety. The NTSB stated the data “did not show a significant improvement in safety.”
Meanwhile, the Board on June 20, 2012, also published a formal Safety Alert on in-cockpit weather systems, emphasizing that weather radar data can be as much as 15-20 minutes old by the time it’s displayed in the cockpit. The Board also highlighted two specific fatal accidents where such latency may have been a factor—the data was available to the pilots, but they crashed anyway. All of which indicates glass and Nexrad haven’t had the hoped-for beneficial impact on safety over the last 10 or so years. Thus, the NTSB’s 2005 data on differences between accident and non-accident pilots is likely to be just as valid today as it was then.
Age and experience
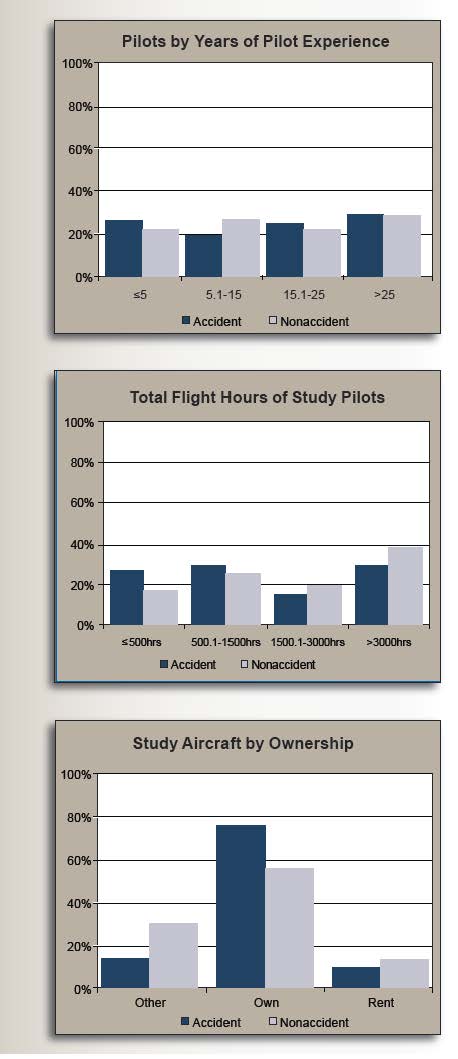
The study looked at several demographics of the accident pilots and non-accident pilots, some of which is highlighted in the charts at left. All but one of the accident pilots were male; of the 135 non-accident pilots interviewed, all but four were male. Additionally, “[t]he median total number of flight hours for the accident group (1300 hours) was lower than the median total flight hours for the non-accident group (2270 hours).
288
Another metric involved whether or not the pilots in the study had earned an instrument rating. That’s important because these were, after all, weather-related accidents. The NTSB found “about 90 percent of pilots in the non-accident group held an instrument rating, compared to 68 percent of pilots in the accident group. The proportion of pilots with instrument ratings differed significantly for the accident and non-accident groups.” Interestingly, and as the study noted, 51 percent of the active pilot population holds an instrument rating.
Age and experience also are of interest. The study’s group of non-accident pilots tended to be younger, while “the accident group included a higher percentage of pilots in the oldest [older than age 60] group.” And non-accident pilots tended to have earned their first pilot certificates before age 25, “while the percentages represented in all other age groups were higher for accident pilots.” As the graph at top left depicts, the study found differences in years of piloting experience helped little in determining who might have an accident.
Testing, accident history
Another variable the NTSB examined involved success rates on FAA written and practical exams. The non-accident pilots studied achieved a mean cumulative pass rate of 95 percent in both types of exams. Pilots involved in the studied accidents had a mean cumulative pass rate of 86 and 84 percent, respectively, for the written and practical exams they had taken.
The NTSB also found what it called a statistically significant difference in the accident/incident/enforcement histories of accident and non-accident pilots. Unsurprisingly, 19 percent of accident pilots had been involved in a previous mishap—for four of the 72 accident pilots, the studied event was their third. Six of the 72 accident pilots had an enforcement record with the FAA, while only three of the 135 non-accident pilots had committed a violation.
Weather Resources
Since these were weather-related (as well as pilot-related) accidents, the NTSB determined the extent, if any, to which both sets of pilots had obtained pre-flight weather information. These data necessarily are not as refined as, say, that regarding demographics.
In 66 percent of the 72 accidents, the pilots had obtained “pre-flight weather information.” The study noted “it is likely that some of the remaining 34 percent of accident pilots sought weather information that could not be identified after their accidents.” By contrast, “94 percent of non-accident pilots had checked at least one source for weather information” before takeoff.
Conclusions?
Some of the study’s findings and recommendations are summarized in the sidebar at right. That said, some of the study’s results were surprising to us, especially those associated with pilot age and experience.
This article simply scratches the surface of the pilot-related information in this study. Look for additional details in a future issue.


