
For the past couple of years, the NTSB, FAA and industry interest groups have been able to point to reductions in both overall and fatal GA accident rates as welcome signs of progress. Without question, this is better news than if those numbers had been going up, but the processes that produce official accident data are quirky and counterintuitive enough to make the significance of those declines difficult to assess.
Worse, the inherent limitations of what information is collected, when and how make it impossible to answer questions of obvious interest and practical concern, such as the importance of time in type and the changes in risk profile that accompany increasing pilot experience.
Know It When You See It?
An aircraft accident would seem like an easy thing to identify: Look for the smoking crater with a few pieces of empennage sticking out, right? Okay, that one probably qualifies. But the national statistics are derived from a very specific definition of “accident” that’s not based on either the event’s immediate effects on airworthiness or the projected cost of repairs. Airplanes can be and often are scrapped for damage that would cost more to fix than their hulls are worth but still doesn’t qualify as “substantial” enough to merit reporting. Conversely, damage that does qualify sometimes goes unnoticed by the pilots who inflicted it, only to be discovered on a later pre-flight inspection.
What gets counted is determined by 49 CFR Part 830, the regulations governing which occurrences must be reported to the NTSB. To qualify as an “accident,” two conditions must be met: the aircraft was occupied “with the intention of flight” (with a recently added exception covering drones), and the event caused death or serious injury to some person and/or “substantial damage” to an aircraft. “Serious injury” and “substantial damage” are also defined in detail.
The former is pretty intuitive, including hospital stays of two days or more within a week of the event; damage to internal organs, muscles, nerves or tendons; second- or third-degree burns; and broken bones other than fingers, toes or nose. To be counted as “fatal,” death must result within 30 days. The latter is defined as “damage or failure which adversely affects the structural strength, performance, or flight characteristics of the aircraft, and which would normally require major repair or replacement of the affected component.” But there’s a long list of exceptions that effectively rules out most gear-up landings in retractables (see the sidebar above, “You Don’t Call This ‘Substantial?”). Engine failures ending in successful forced landings without further damage are likewise excluded.
This combination usually makes sense, but can create some odd artifacts. If a pilot taxis into a hangar trying to program the GPS on the way to the runway, it’s an accident. If a mechanic hits the same hangar while doing a ground run, it isn’t. Worse, if that mechanic taxis into the tail of a parked airplane in which a student and instructor are running the engine start checklist, their airplane will be counted as having been in an accident while the one that was actually moving will not. As one result, NTSB staffers often begin public presentations with a series of slides, inviting the audience to vote “yes” or “no” on whether the image resulted from an accident. The straight-tailed 172 lying on its roof is a “no” (it was ripped out of its tie-downs by a microburst). However, the Cherokee 140’s firewall was bent when a wheelbarrow landing collapsed the nose gear, making it a “yes.”
The Investigative Process
Watching television footage of the “Go Team” surveying the field of wreckage, it’s easy to forget just how small the NTSB actually is. Its total national staff for all modes of transportation—roads, waterways and pipelines as well as aviation—numbers just a couple of hundred, less than the payroll of a small regional hospital. That includes legal, administrative and accounting personnel as well as the technical experts in the recording device and materials labs. The aviation branch accounts for about half. Perhaps 60 are actual on-scene investigators, whose time is necessarily devoted to the most serious crashes.
Information about less severe events generally comes from the FAA, emergency personnel and the pilots involved. An inspector from the local FSDO is usually the first aviation expert on the scene, and if there’s little doubt about the factual circumstances, that inspector’s evaluation becomes the basis of the Board’s final report. Even more straightforward sequences may be resolved solely on the basis of the pilot’s written report (Form 6120.1): Who’s going to argue with the student who admits to losing control in a crosswind?
The level of detail captured varies for other reasons. Pilots who die in the cockpit tend to provide far less information—on their training, recency of experience, and so on—than those who survive to be interviewed, and often their logbooks are never located. As a result, make-and-model experience is never determined for two-thirds of all fatal accident pilots…and two-thirds of those for whom time in type couldn’t be established were killed in the crashes that raised that issue. (And, yes, those are two distinct statements. Neither implies the other.)
In the absence of up-to-date logbook entries, even cumulative flight experience can be difficult to pin down. The best remaining sources are insurance applications, rental profiles, medical certificates and the certificate or rating application (FAA Form 8710-1). The first two are usually more current but of dubious veracity—those filed around the time of FAA medical exams tend to claim more time than reported to the Feds. The medical applications of non-professional pilots, on the other hand, may be up to five years out of date, and the advent of Basic Med will only exacerbate that situation. The FAA Form 8710-1 may be the most current (and presumably accurate) record of pilot experience, but that’s not common.
Similar concerns apply to aircraft records. Logbooks are usually available for commercial, rental and flight school craft, but private owners’ aircraft logs may never turn up, making maintenance history and AD compliance impossible to assess. It’s been pointed out that if a $50 million jury verdict was riding on the outcome, all this information would come to light, but that kind of money usually isn’t involved.
Compared to What?
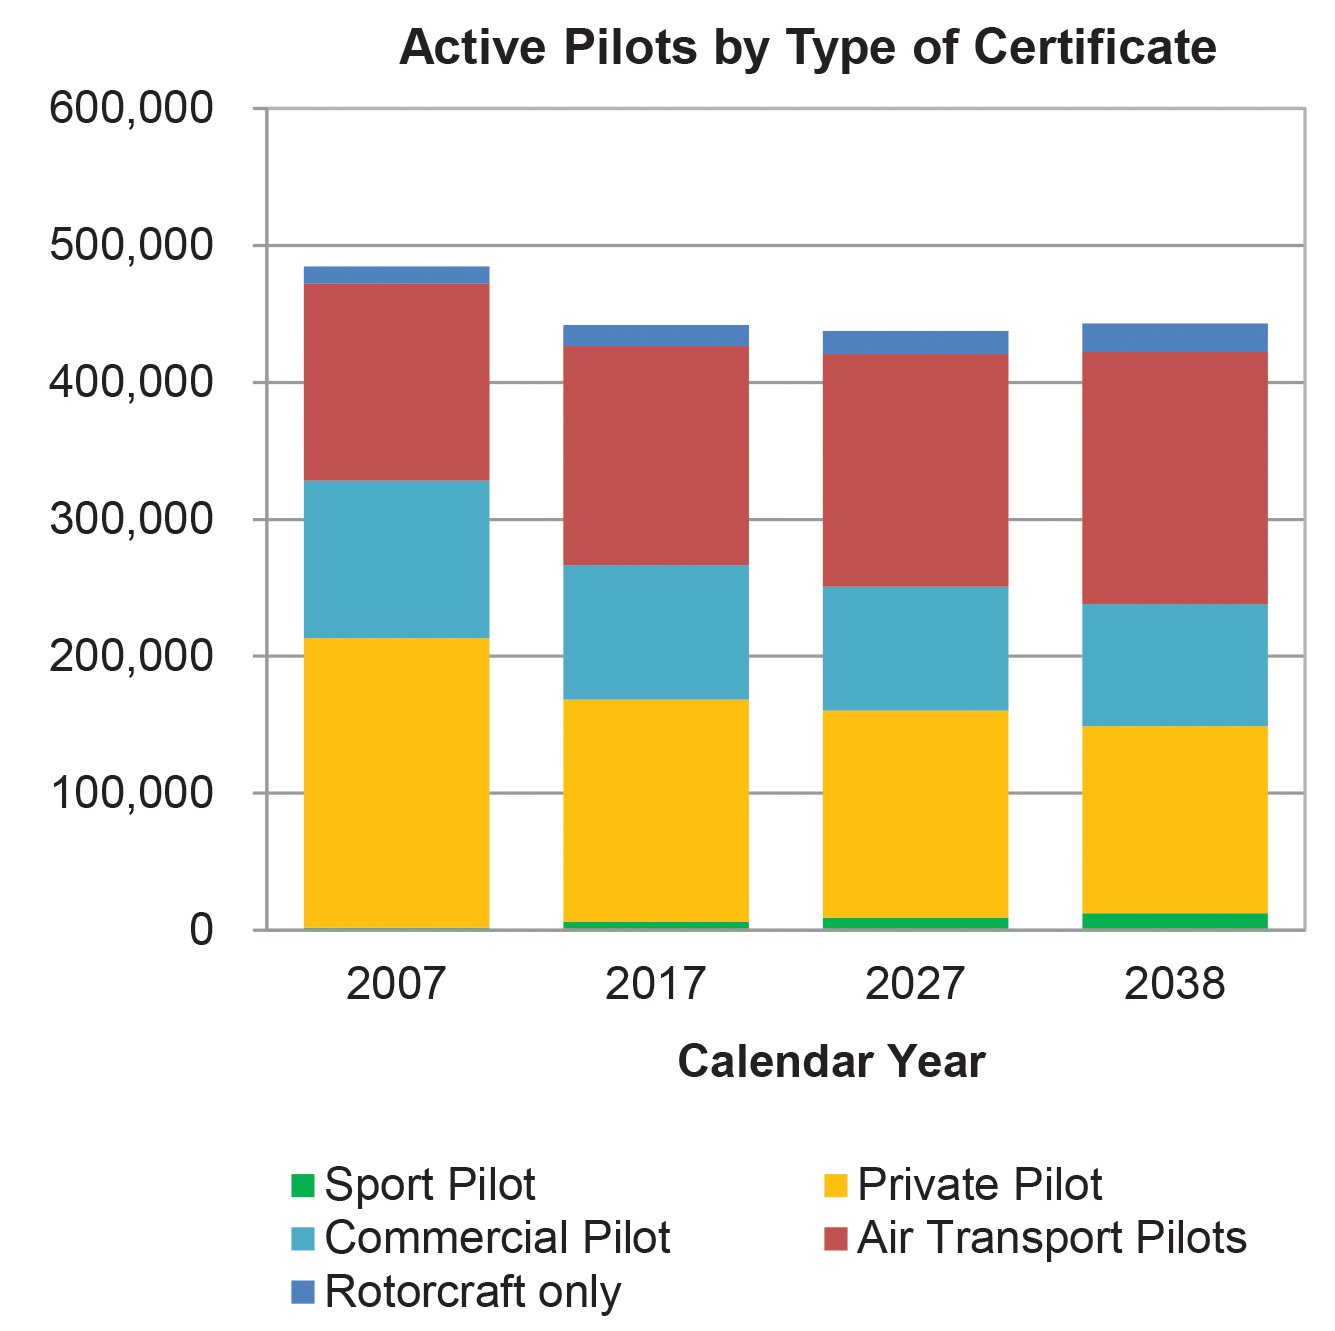
For all its limitations and inconsistencies, our knowledge of accident pilots and their aircraft is incomparably richer and more complete than our picture of the population from which they’re drawn. The FAA does publish raw numbers of “active” pilots (defined as holding current medical certificates) by certificate level, age and gender, but there is no reliable source of information on the experience, level of activity, involvement in recurrent training, health, time in type or instrument currency of the hundreds of thousands of pilots who avoid accidents every year.
This makes it impossible to put whatever descriptions of accident pilots we can make into meaningful context. Suppose, for example, that 40 percent of the private pilots had less than 250 hours of total time. If only 20 percent of all private pilots claimed 250 hours or less, this would suggest an excess risk but would demonstrate a protective effect if that proportion was really 70 percent. With no way to know which is closer to the truth, there’s no way to tell whether 40 percent is good, bad or exactly as expected.
Don’t Ask
So how accident risk relates to total experience, current level of activity and time in make and model are among the questions we don’t have the data to answer. Another question of at least equal practical importance is comparing different aircraft models.
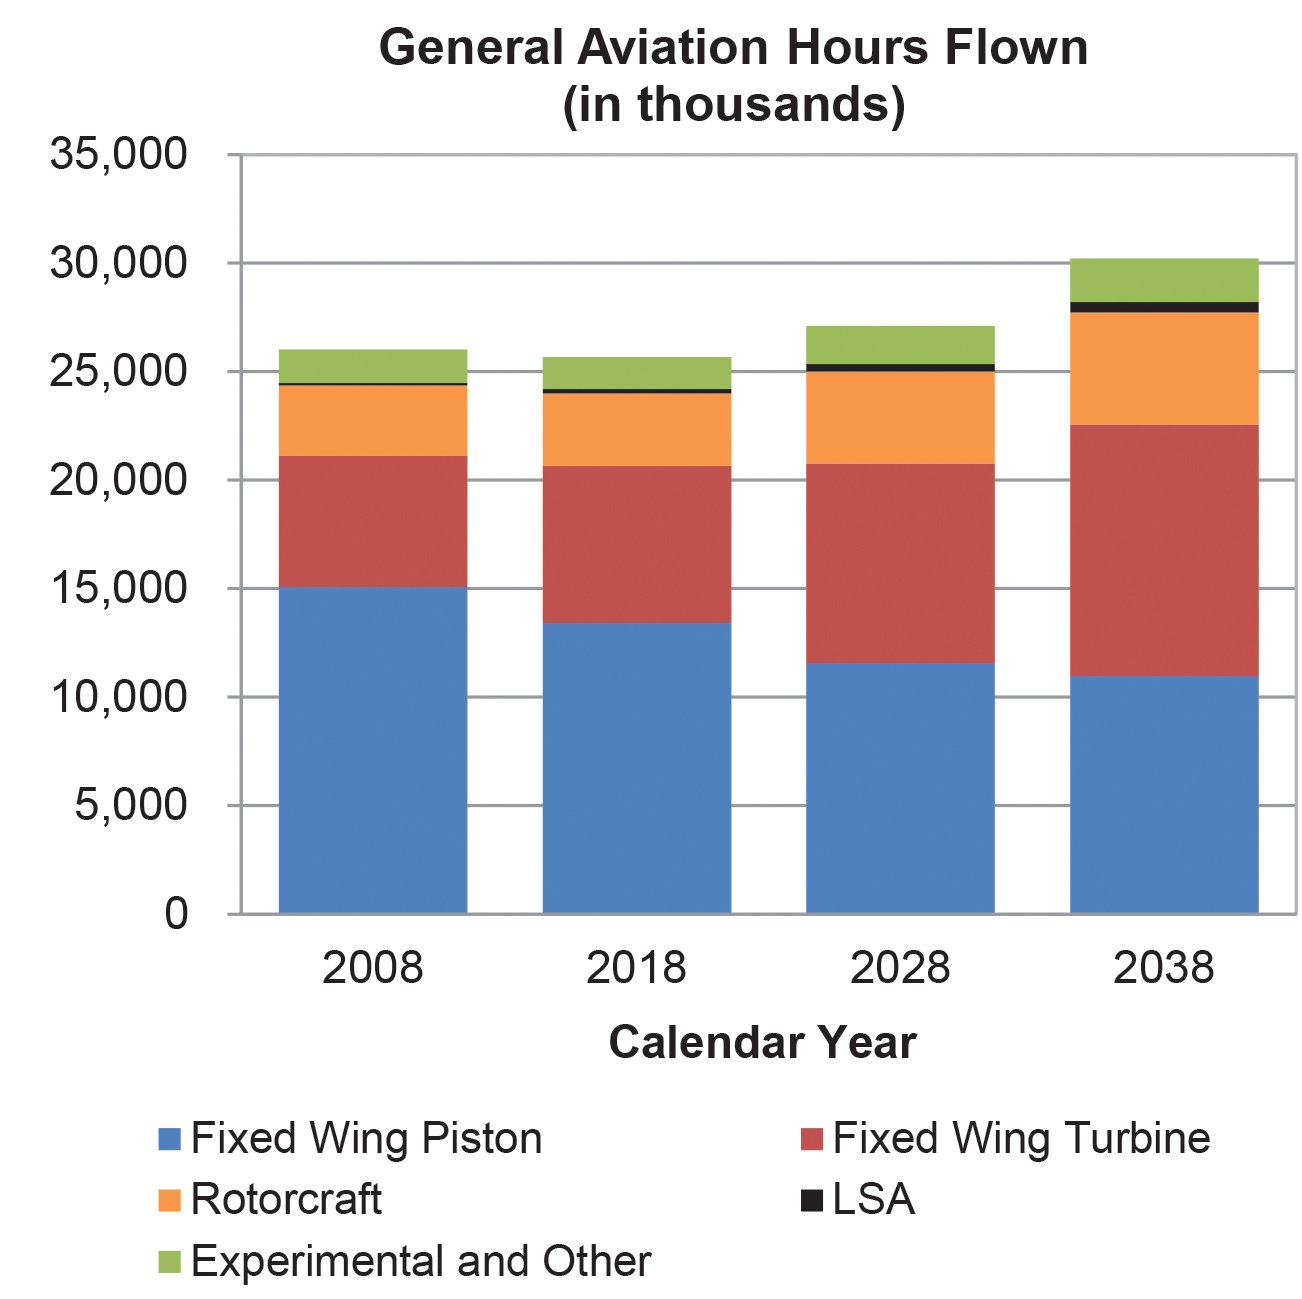
The annual FAA activity survey that provides our overall estimates of flight activity (see the sidebar on the opposite page, “Rates and Measures”) doesn’t collect enough data to pin down annual flight time by make and model. Without a benchmark against which to standardize, the raw numbers of accidents don’t provide much information. (A retired airline captain of our acquaintance liked to tell prospective passengers that his Cessna 172 was “the most frequently crashed airplane in history”—a distinction owing more to the tens of thousands produced in the type’s ongoing 60-plus-year history than any design flaw.)
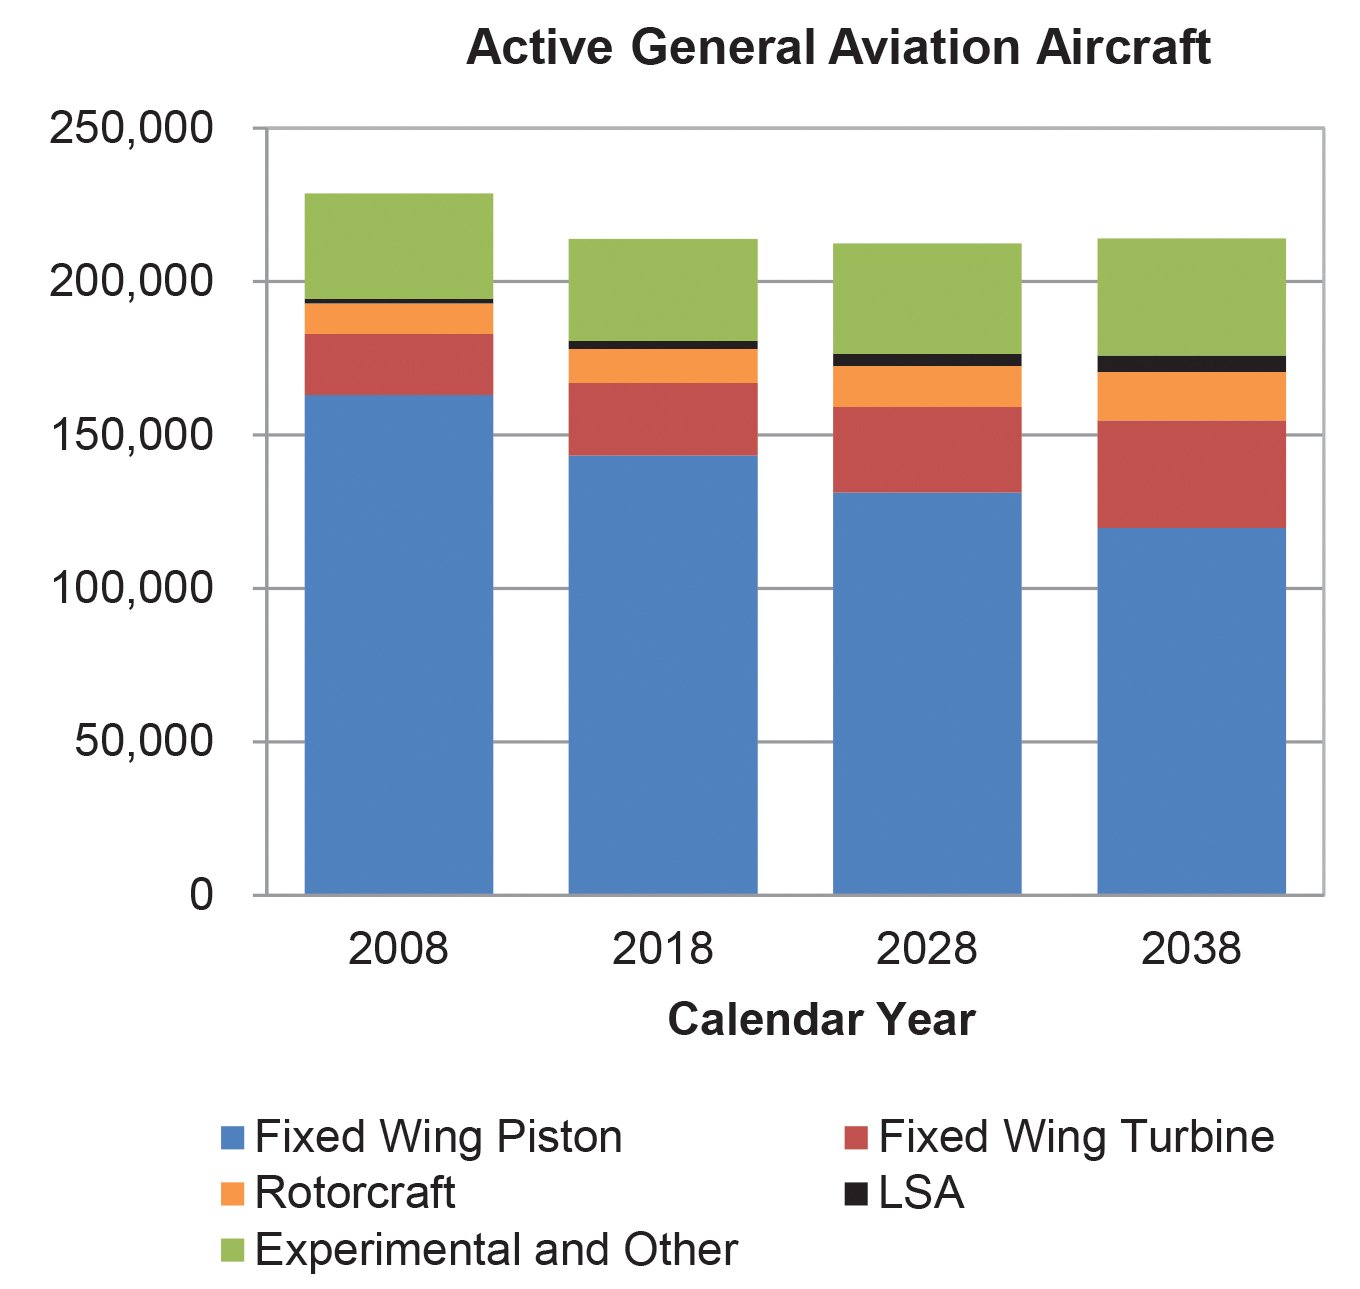
Triennial registration has helped narrow the gap between aircraft registered and aircraft flying, but attempting to standardize by fleet size rests on untestable assumptions about not only how much they’re flown, but for what purposes. We already know that the accident profile of flight instruction is quite different from that of personal travel; how would that inform a contrast between Skyhawks and Skylanes?
So what can we do with the numbers that are out there? Here are a few suggestions:
• Pay attention to who’s pushing them. If the figures align too neatly with the interests of their purveyor, reach for the salt shaker.
• Be wary of percentages; discount them completely if you can’t answer “percent of what?” Remember, one may go down just because another went up (or vice versa). Is a lower share of runway excursions than in other taildraggers of similar size evidence of better ground manners, or more frequent engine failures?
• Don’t overinterpret short-term fluctuations. A one-year drop from 1.05 to 1.01 fatal accidents per 100,000 flight hours could easily be noise in the data. Invest some trust in recurrent trends measured by methods that haven’t changed, but maintain perspective. Five straight years of consecutive declines may suggest a real improvement, but the real-world significance of a decrease from 1.05 to 0.97 is less than overwhelming. Use your common sense.
Rates and Measures
“Rate” is one of those words commonly used in ways far outside their technical meaning. To a statistician, a rate is the average number of events for some fixed measure of exposure (usually time, though “bushels per acre” is a familiar example of a spatially based rate). The observed event count is one realization of a random process—a long-term average of 10 might produce nine one year and 12 the next—but the associated exposure is usually known without error. What makes general aviation accident rates difficult to compare is that the most relevant measure of exposure has to be estimated. Those estimates are also subject to random variation.
Since more flying means more chances for mischief, accidents are gauged against aggregate flight time, which changes considerably from year to year. The FAA’s annual activity survey estimates it within segments of the industry from a random sample of aircraft owners; some categories, including Alaskan operators, are surveyed more intensively than others. The sample selection process itself, who actually responds and how carefully they review their records all introduce random fluctuations that make the survey results imperfectly representative. When published, the results include estimates of the resulting margins of error.
You Don’t Call This “Substantial?”
The NTSB’s definition of “substantial damage” found in 14 CFR Part 830 specifically excludes: “Engine failure or damage limited to an engine if only one engine fails or is damaged, bent fairings or cowling, dented skin, small punctured holes in the skin or fabric, ground damage to rotor or propeller blades, and damage to landing gear, wheels, tires, flaps, engine accessories, brakes, or wingtips….” That’s a lot of shop time and replacement parts, and it’s often enough to cause insurers to write off older retractable models that suffer gear-up landings. But unless there’s a fire or other parts of the airframe get bent, these don’t appear in the accident database.
During 2017, for example, reports of 167 gear-up landings appeared in the FAA’s daily preliminary reports (we’ve been logging them). Eleven were the result of either mechanical failures in the gear-extension or electrical systems, or deliberate choices by pilots facing off-field landings. Of the remaining 156, only 12 qualified for reporting to the NTSB. At a probably conservative estimate of $50,000 each, the 92 percent that didn’t make the cut represent $7.2 million in additional repair or settlement expenses, and would have increased that year’s accident count and the associated rate estimate by a solid 10 percentage points.
David Jack Kenny has been a statistician twice as long as he’s been a pilot, but enjoys flying more than twice as much as analyzing data. He’s a fixed-wing ATP with commercial privileges for helicopters.


